August 30, 2026
Fixed The Dashboard When You Pick A Custom Date Range
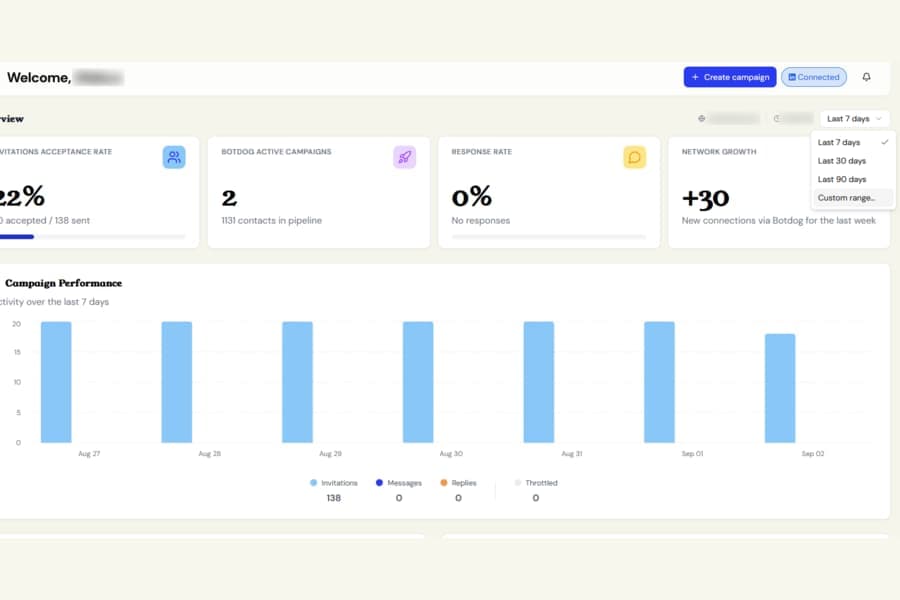
We fixed a few issues that appeared when using Custom range… in the dashboard date picker.
Network Growth now uses the right description
The Network Growth card previously showed:
New connections via Botdog undefined
It now correctly says:
In the selected date range
Campaign Performance now follows your full date range
The Campaign Performance chart previously kept saying Activity over the last 90 days, even when you had selected completely different dates.
It could also cut the chart back to the most recent 90 points.
The chart now:
- Shows your actual selected dates, such as Activity from Mar 2 to Mar 8, 2026
- Displays the full date range you asked for
We also fixed two smaller chart issues:
- The shading that marks days when LinkedIn paused your invitations now displays correctly
- The Throttled count is hidden on longer date ranges, where the chart switches to weekly grouping and a daily count would no longer be useful
If you only use the Last 7, 30, or 90 days options, nothing changes. Those views were already working correctly.